
(Just Starting to) Analyze Performance Data
If you’ve done any performance testing, or even seen a demo, you are probably familiar with the “big line graph” that is created as the test runs. A Typical Response Time Graph The typical scenario is simple: Have the load tool start with one simultaneous user running a script. Then add a new user, say, every thirty
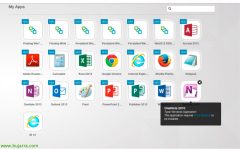
Testing .NET application in Citrix
Expanding with .Net application through Citrix Portal