

 I’ve been that guy. You may be that person some day … you may be that person now. Either way, it is safe to sat that those in that position would prefer to be out of it.
The manager wants to fix the problem, so he goes downstairs to the DBAs and tells them. The DBA’s do some research and find out that the memory percentage is way high, so the database is going to disk (a lot), and disk is slow.They suggest buying a great deal more memory , which is the cheap and easy solution.
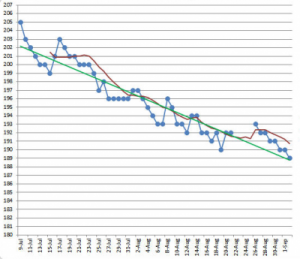
In most cases, the solution is a lot more complex, and involves tuning, news boxes, creating new indexes, maybe upgrading the network switch. After two days, two weeks, two months or two quarters, the DBAs say they are done, and show some dashboards like the one above, with all the data trending in the right direction. Average CPU use is down, so is memory, disk I/O requests are down, response times are down – everything looks good.
Allow me to ask, just for the sake of argument. What happened to average customer response time?
We don’t know.
It is this problem, our love affair with data that is often irrelevant, that Method-R solves.
Our Love Affair With Data
The 20th century was the age of the engineer, of proof, evidence, and hard data. Physicists could prove an airplane could fly with equations; they could prove a bridge was sound, even model the universe and create the atomic bomb. Around that same time, other sciences, especially the software ones, began to develop what was known as “physics envy” – an affinity for data, any data, that was ‘hard’, that could prove a point.
Which brings me to our hapless IT manager. You see, he could sit with a stopwatch for a long-running query, and measure how long it takes to be complete. Then, when the improvement is over, he could do it again. The problem is the variables – the table could be in memory the first time and not the second, the network might have been saturated the second time.
Measure the time for one user? Seriously? That’s crazy. We need hard data man. CPU. Network latency; throughput. Transactions per second. Queries per second. That’s where it’s at, man.
The basic argument of Method-R is that I really only care about one thing: The user experience. All of those other things are not the user experience.
Here’s the methodology from the Method-R Website:
Method-R prescribes four simple steps:
- Identify the task that’s the most important to you.
- Measure its response time (R) – in detail.
- Optimize that response time in the most economically efficient way.
- Repeat until your system is economically optimal.
Trivially simple, right? Can you believe they make a whole book out of that?
Implementing those ideas, in practice, turns out to be a little bit harder. Believe it or not, when I’ve seen people take the CPU/Memory/Disk performance route, it’s often not because of physics envy, but because those measurements are easy to get, and the Method-R numbers are hard.
Here’s why.
Method-R considers the whole process, from database, through application, the network, and the end system. The challenges I have found with Method-R are (1) Finding the representative set (“what do we want to measure, end-to-end?”), (2) Measuring the end-to-end-run, and (3) Profiling – breaking down each piece of what happens to find the bottlenecks. But that’s for another day.
For today, it’s enough for me to ask this. When you run into performance bottlenecks on your projects, when the customers are coming in saying “It’s Slow”, what do you do next, why, and how is that working for you?
Before we can talk about using Method-R well, let’s start with the barriers to it.